Summary
| All in One monitoring from the Cloud | |
| A Service from | Monitis (USA) |
| Useful for | Monitoring Websites, Servers, Networks, Cloud (Public, Private) |
| User Interface | Slick, Intuitive & Interactive Charts & Graphical representations |
| Technology | Ajax, JavaScript, HTML5 |
| USP | Cloud Based SaaS model |
| Limitation | Check Detailed Review |
| Customer Care | Prompt & meaningful response (I used live support) |
| Conclusion | Recommended |
Detailed Review

- External Monitor (HTTP, FTP, e-mail, VoIP, MySQL, Ping, TCP, UDP, Web Page Content)
- Traffic Monitor (Visitor Tracking)
- Full Page Load Monitor (Analyze the load time of every element on your web page)
- Internal Monitor (CPU, memory, storage, configuration, events, processes, internal ping, SNMP Object New!)
- Cloud Monitor (instance start, stop, external and internal monitoring rules, notifications)
- Amazon
- Rackspace
- GoGrid
-
- Transaction (multi-step applications) Monitor
- Log Parser
Currently I am using Monitis Cloud based All in One Monitoring for the following three categories:
- External Monitor (HTTP, FTP, e-mail, VoIP, MySQL, Ping, TCP, UDP, Web Page Content)
- Traffic Monitor.
- Full Page Load Monitor (Analyze the load time of every element on your web page)
For external Monitoring I used my blog and another web based application. You can add different Monitors to your Welcome Window.
External Monitoring:
- Website Uptime
- Average Response Time
- Location wise chart & availability
- Date-wise or last 7 days etc.
Visitor Tracking
- Visits
- Total Page Views
- Average Page Views Per Visit
- Hourly basis visitor tracking
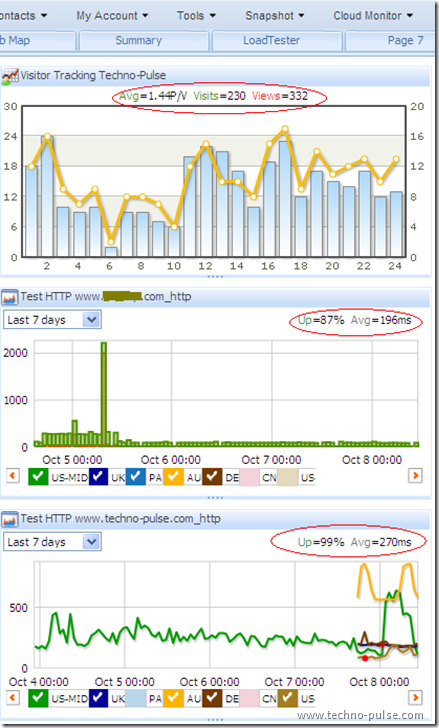
The results were presented in an user friendly manner. The user interface is quite intuitive. You’ve the options of tabular data, Pie chart, Bar chart, Line chart etc. Check the following screen shot. The 1st chart shows A bar & line chart of Visitors on an hourly basis. 2nd graph shows a bar chart website availability & Response time. 3rd graph shows a line chart for my blog’s uptime & availability from different locations of the world.
Full Page Load Monitor
It shows no data to display. I am wondering why? Yet to contact their tech-support on this issue. I’ll update you later about it.
Benchmark
I compared the visitor’s tracking of my blog, reported by Monitis to Google Analytics. On a daily basis, visitors count reported by Monitis were quite close to Google Analytics count. Check the stats of this blog (techno-pulse.com) for October 7, 2010:
| Monitis | Google Analytics | |
| Visits | 230 | 236 |
| Page Views | 332 | 360 |
Noteworthy features
- SMS notification (Real-time notification incase any of your service fails)
- I did get the activation SMS but didn’t receive any alerts there after.
-
- e-Mail Notification
- It’s on a regular basis in a presentable format
-
- Scheduled Maintenance of your server can be configured (if you’ve prior notice)
- Notification Rules
- Actionable Reports
- Configure & get your own reports
-
- Export to PDF/CSV
- Quite handy when you want to print Reports
-
- Ajax pop-ups (reduces the load time)
- Makes it highly interactive & user friendly
-
- Share
- Click & Share reports by e-Mail.
-
- Live Support
- 24/7 & most of the times I found them prompt. But on a few occasions it seems no one was available for chat.
-
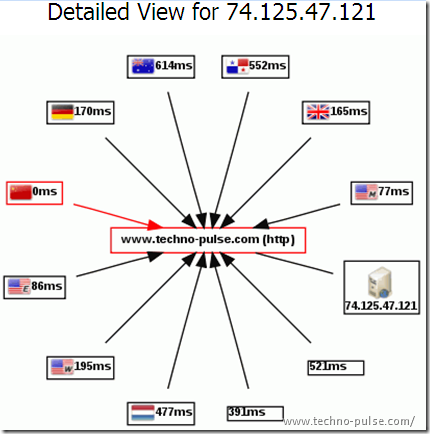
- The following screen shot of a Web Map shows a summary of Response time from different locations. The RED arrow signifies an issue in accessing the website/blog at that location.
Conclusion
Recommended. I am trying other Monitis monitors as well. Stay tuned to read more about their other offerings in coming days…
Cloud Computing Articles at Techno-Pulse
- Best & Free Cloud Computing Applications
- India Based Cloud Computing Service Providers
- Cloud Based Project Management – DeskAway SaaS
- Develop SaaS on OrangeScape PaaS to Run on any Cloud Infrastructure
- Cloud Computing Service: A Basic Introduction – 1
- Cloud Computing: A Basic Introduction – 2
- Cloud Computing Platform Introduction - PaaS
- Cloud based on-Demand SaaS CRM for India: Impel
- Develop Cloud based SaaS Applications on Wolf Platform
- SaaS Introduction with Example – Cloud Service
- Sync.in Review - Real-time Collaboration in Cloud


Monitis looks like a cool service. Indeed I was looking for some cloud service to monitor my blog's uptime. I'll definitely give it a try. Is it a free service?
ReplyDeleteLooks like Google Analytics in terms of visitor tracking. But Monitis has some extra features like uptime tracking etc.
ReplyDeleteMon.itor.us is a part of Monitis family, which provides professional, premium all-in-one monitoring service for free.
ReplyDeletehttp://mon.itor.us/
oh information sounds cool, let me too try the trial :D
ReplyDeleteGood services by monitis, sign up for trial of FREE monitoring of your websites, servers, networks, and applications at http://monitorscout.com
ReplyDeleteI have started using hostpinger.com for monitoring my web servers. They are providing cloud host, local host and hardware host monitoring solutions all at one platform. I signed up for free and got 50 tests absolutely free.
ReplyDelete